APPROFONDIMENTI:NEW ANALYSIS OF COMPREHENSIVE PER CAPITA EMISSIONS
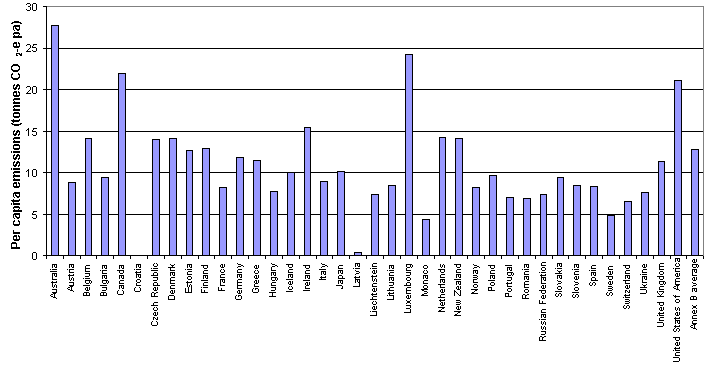
A cursory analysis indicates that Ireland’s high emissions can be explained by the large contribution made by its agricultural sector, which accounts for around one-third of total emissions. Luxembourg’s high per capita emissions are related to its large steel industry (which has contracted significantly since 1995). Australia, Canada and the USA are all large consumers of energy, but Australia also generates a large proportion of emissions from agriculture and land-use change and forestry. These three are examined in more detail below.
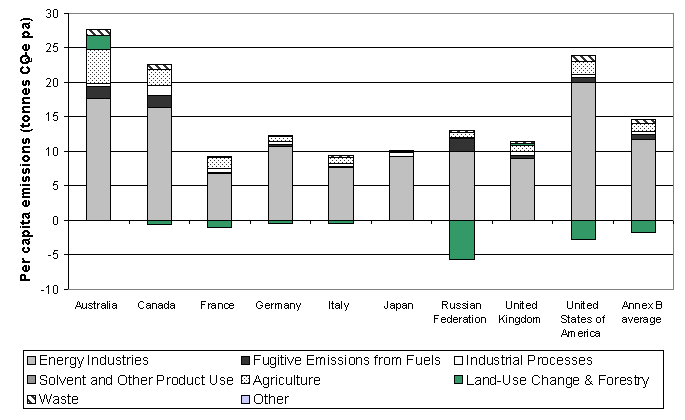
Figure 2 presents a sectoral breakdown of per capita emissions for selected Annex B countries.[2] For land-use change and forestry, net removals are shown below the horizontal axis. For those countries with net removals from this sector, the amount shown below the axis should be subtracted from the aggregate emissions above the axis to give net emissions per capita.
It is apparent that the USA generates the largest emissions per capita from fuel combustion, but falls behind Australia and Canada when emissions and removals from all sources are compared. Canada’s per capita emissions exceed those of the USA due to higher per capita emissions from fugitive emissions and a lower contribution from sinks. Australia’s emissions per capita are especially high because land-use change remains a net source of emissions, and emissions from agriculture are high. As a result, Australia has the highest per capita emissions of any industrialised country. By contrast, land-use change and forestry makes a relatively large contribution to reducing net emissions in the USA and the Russian Federation.
Source: Table 1 above
References Hamilton, C. & Turton, H. 2002, ‘Determinants of emissions growth in OECD countries’, Energy Policy, Vol. 30, No. 1 (forthcoming January 2002) IPCC 1997, Revised 1996 IPCC guidelines for national greenhouse gas inventories, Intergovernmental Panel on Climate Change/OECD/IEA World Bank 2001, Health, Nutrition and Population Statistics, Development Data Group, Human Development Network, http://devdata.worldbank.org/hnpstats/ UNFCCC 1992, United Nations Framework Convention on Climate Change, http://www.unfccc.de/resource/conv/index.html UNFCCC 2001a, Greenhouse Gas Inventory Database: Introduction, United Nations Framework Convention on Climate Change, http://62.225.2.23/introghg.htf UNFCCC 2001b, Greenhouse Gas Inventory Database: Sources of data for Annex I Parties, United Nations Framework Convention on Climate Change, http://62.225.2.23/infosrc.htf
[1] With the exception of The Australia Institute’s earlier calculations, published on the web, in 1999 for Annex B countries in 1995. [2] A systematic analysis of the sources of growth in energy-related greenhouse gas emissions in OECD countries over 1982-1997 (including the effects of changes in population, economic growth, energy intensity, primary energy use, share of fossil fuels and the carbon intensity of fossil fuels) can be found in Hamilton and Turton (2002).
| |||||||||
|
|